Chicago’s roadways remain complex, and while traffic fatalities saw a significant reduction in 2024, road safety remains a critical concern. In 2024, Chicago recorded 112,006 car crashes, highlighting the persistent risk motorists, cyclists, and pedestrians face daily. While these accidents resulted in 124 fatalities, the number of serious injuries remained high, with over 25,000 injuries recorded in recent reports.
If you have been injured in an accident, we are here to help. Contact Duncan Law Group for experienced car accident attorneys who know how to handle even the most challenging cases.
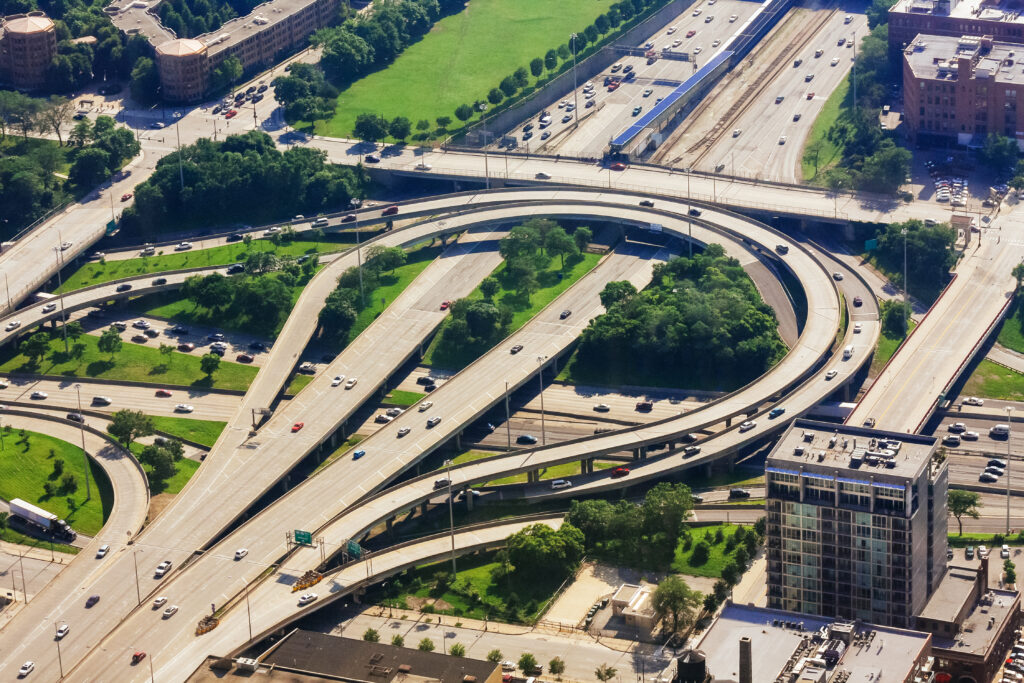
Beyond specific intersections, Chicago’s traffic safety is best understood through the High Injury Network (HIN). Developed by CDOT, the HIN is a data-driven map identifying the 100 miles of major street corridors where serious injuries and fatalities are most frequent. These corridors account for nearly one-third of all traffic fatalities on major streets.
Rather than relying on static rankings, modern safety requires looking at these high-risk zones, such as Stony Island Avenue, Cicero Avenue, and Western Avenue, which consistently rank as dangerous due to high commercial truck volume, heavy commuter traffic, and complex multi-lane configurations.
Chicago’s High-Injury Network: Priority Safety Zones
The following intersections within the HIN represent the highest points of conflict based on the most recent crash data:
To better understand why these locations remain high-risk, we have analyzed the specific factors, such as transit volume and road design, that contribute to crash frequency.
Navigating the Intersection of 79th Street & Stony Island Avenue
This intersection remains a focus for safety efforts due to complex overlapping traffic flows, heavy bus activity, and high commercial truck volume. Use the Chicago Skyway or parallel neighborhood streets during peak hours to avoid the worst congestion.
Safety Challenges at 95th Street & Stony Island Avenue
A primary access point for residential and commercial corridors, this area often sees high-frequency side-impact collisions. Avoid "beating the light," as the high speed of traffic here leaves very little room for error.
Why Garfield Boulevard & Wentworth Avenue is a High-Risk Corridor
The proximity to the Dan Ryan Expressway and the Garfield Red Line station makes this a chaotic zone. Expect unpredictable pedestrian behavior from transit commuters and be prepared to yield, even when you have the right of way.
Crashes by Neighborhoods
Traffic safety risks are not evenly distributed, nor are they caused by infrastructure alone. Recent 2025 and 2026 analysis highlights that South and West Side neighborhoods, specifically Austin, West Garfield Park, and North Lawndale, experience a disproportionate share of severe traffic violence.
Male drivers aged 16–29 consistently exhibit higher rates of risky driving behaviors, including speeding and impaired driving which are primary contributors to the city’s most severe traffic incidents
What Are the Main Causes of Chicago Car Crashes?
Current data confirms that human behavior remains the leading factor in the majority of traffic collisions. Common causes of car crashes include:
Distracted Driving: Mobile device use is currently cited as a contributing factor in roughly 35 percent of recent crashes, remaining the top cause of preventable accidents.
Failure to Yield: A leading cause of intersection collisions, particularly when drivers misjudge turn timing.
Speeding and Failure to Reduce Speed: A primary factor in high-fatality incidents.
Data Overview and Takeaways
City-led efforts to redesign dangerous intersections remain a top priority, but safety also depends on individual responsibility. CDOT’s “complete streets” approach has been shown to reduce severe crashes by up to 50% in high-risk corridors.
Between 2024 and 2025, CDOT applied standardized safety designs across projects citywide, completing the following improvements:
Installation of more than 13,000 ADA-compliant curb ramps
Addition of over 2,100 safety features, including refuge islands, curb extensions, raised crosswalks, bus boarding islands, and bus bulbs
Development of more than 90 miles of bikeways and dedicated bus lanes
All road users should continue to signal clearly, stay focused by avoiding mobile device use, and remain alert in areas known for increased risk.
Contact a Chicago Car Accident Lawyer at Duncan Law Group
If you have been involved in an auto accident at any of these high-risk intersections or anywhere else in the city, having a personal injury lawyer who understands how to analyze Chicago traffic data and coordinate insurance negotiations can be critical. Duncan Law Group has the experience and resources required to investigate the specific hazards of your accident site, hold the at-fault parties accountable, and fight for the full compensation you deserve.
Do not let an insurance company minimize your injuries or shift blame. Contact us today at (312) 202-3283 to schedule your free, confidential consultation. Our team is ready to review your case, explain your legal options, and help you strategize your next steps toward recovery.
The information on this website is for general information purposes only. Nothing on this site should be taken as advice for any individual case or situation. This information is not intended to create, and receipt or viewing does not constitute client relationship.
Send Us Your Case Details
We’ll respond and let you know the best way to proceed with your case.